Overview
The purpose of this project was to connect our every day lives with mathematics. Our task was to pick something of our interest in our every day lives, and connect it to mathematics by using a fundamental concept called a transformation. After deciding on what topic to do this project on, we had to collect data, whether by experiment or research. We then had to figure out whether or not the function was linear or not and use a in and out table. We could pick anything we wanted/had an interest in for this topic, and display it in a very creative display.
Background
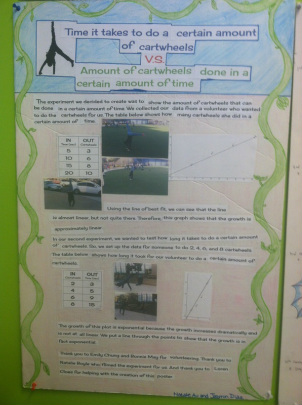
My partner for this project was Jasmin Diaz. At first, we didn't know what to do this project on because we both had really different ideas. Eventually we decided on conducting an experiment of how many cartwheels someone can do in a certain amount of time. While we recorded the information that we needed, while two volunteers (Emily and Bonnie) did the cartwheels for us. We chose to do this experiment because it seemed really fun, and we were both interested in seeing how many cartwheels someone can do in a certain amount of time, and also the opposite of how long it takes someone to do a certain amount of cartwheels. The first thing we did while conducting these experiments is having one person record the data using an In and Out table, while another times, and another person filming/taking pictures for benchmark #3. It took us a couple tries in order to get the data that we needed, and our experiment ended up being very successful.
Linear In and Out tables/Graphs
Linear In and Out table:
In Out
5 3
10 6
15 8
20 10
Approximately Linear Graph:
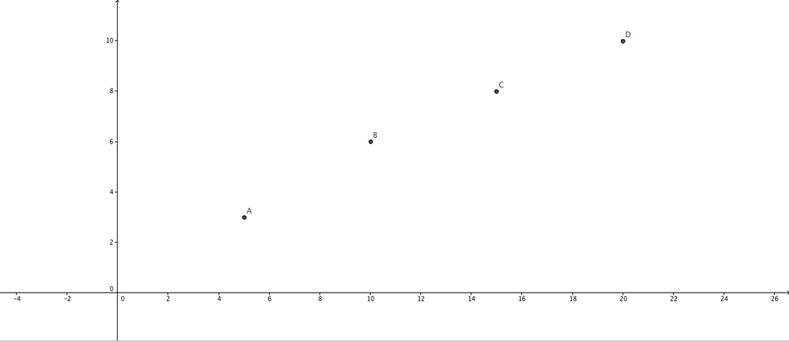
This is the from data that we recorded after conducting our first experiment which was: How many cartwheels someone could do in a certain amount of time.
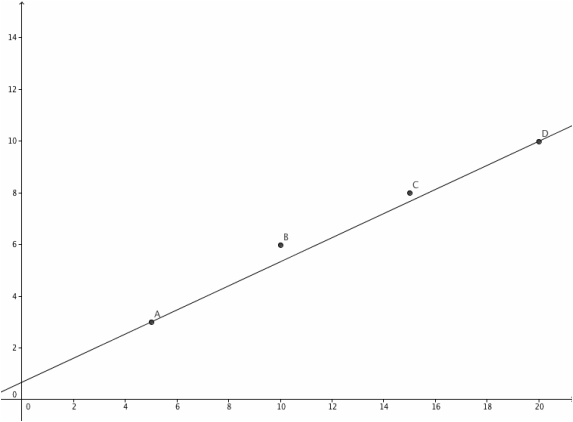
Using only the In and Out table above, the growth is not linear. This is because by using the data, we figured out that the times 5 seconds and 10 seconds, the difference in cartwheels is 3. While between 10 seconds and 15 seconds, the difference in cartwheels is 2. Therefore it is obviously not linear because it does not of a constant slope. However, the graph above shows that the relationship is approximately linear. We figured that the function is approximately linear after plotting the points and finding the line of best fit as shown below:
Using only the In and Out table above, the growth is not linear. This is because by using the data, we figured out that the times 5 seconds and 10 seconds, the difference in cartwheels is 3. While between 10 seconds and 15 seconds, the difference in cartwheels is 2. Therefore it is obviously not linear because it does not of a constant slope. However, the graph above shows that the relationship is approximately linear. We figured that the function is approximately linear after plotting the points and finding the line of best fit as shown below:
Non-linear In and Out tables/Graphs
Non-Linear In and Out table:
In Out
2 3
4 5
6 9
8 15
Non-Linear Graph:
In Out
2 3
4 5
6 9
8 15
Non-Linear Graph:
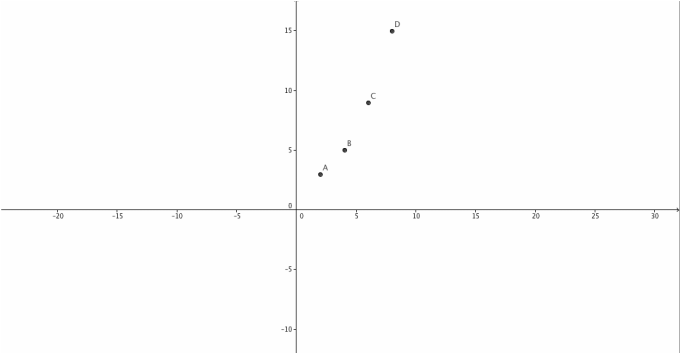
We created this by conducting our second experiment which was how long it takes to do a certain amount of cartwheels.
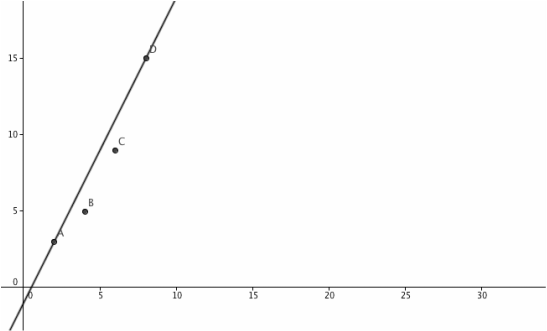
Using this data, we figured out that the growth of the time it took to do a number of cartwheels Is non-linear. Between the 2 and 4 cartwheels, the difference is 2 seconds, while between the 4 and 6 cartwheels the difference is 4 seconds. Therefore, this relationship is obviously non-linear because the slope is not constant. The graph also suggests that the relationship is exponential because the growth increases dramatically. After putting a line of best fit through the points on the graph, we figured out that it is indeed an exponential relationship as seen in the graph below.
Using this data, we figured out that the growth of the time it took to do a number of cartwheels Is non-linear. Between the 2 and 4 cartwheels, the difference is 2 seconds, while between the 4 and 6 cartwheels the difference is 4 seconds. Therefore, this relationship is obviously non-linear because the slope is not constant. The graph also suggests that the relationship is exponential because the growth increases dramatically. After putting a line of best fit through the points on the graph, we figured out that it is indeed an exponential relationship as seen in the graph below.
The creative piece
Jasmin and I decided to create our final piece on a poster board because we wanted to create a very clean and factual final piece. We made sure to include all of the mathematics such as the In and Out tables, as well as the graphs. We also made sure to include pictures of our experiment and make our poster board colorful and easy to read and see. We wanted our final creative piece to be like an info-graphic, and used a website for the formatting.
Project Reflection
Jasmin and I ended up being very successful with this project. Jasmin and I work really well together and we were able to share our ideas, and also compromising as well. Although this is true, it took us a while to figure out what topic we wanted to do for this project. Therefore if I were to do this project again I would want to decide on that sooner, so that I would have more time for the next benchmark. I believe that the habit of a mathematician that I used successfully for this project is to collaborate and listen. I really used this habit when trying to come up with ideas for what to do this project on. I contributed my own ideas, but I also stepped down and listened to what my partner had to say as well. A habit that I could of used, and that would of made my project even more successful that it already was to stay organized. I think that I could of stayed more organized because I recorded my data in separate places when conducting our experiments, and so it was kind of a struggle to put everything together/find everything. I should of been more organized throughout this project in order to make it even more successful. Nevertheless, Jasmin and I ended up being really successful and happy with the way our Mathematical Transformations project turned out.
